What is a Gantt chart? #
A Gantt chart is a type of project schedule that shows both the duration of each phase of work and the dependencies that may exist between phases of work. Named after Henry Gantt, who pioneered the use of the Gantt chart format more than a hundred years ago, Gantt charts have become the most popular way for construction companies to represent a multi-phase schedule. Gantt charts can vary from the simple (for example, a one-phase-at-a-time linear project) to the very complex (multiple phases, complex dependencies, critical path and milestone callouts, budgets, etc.).
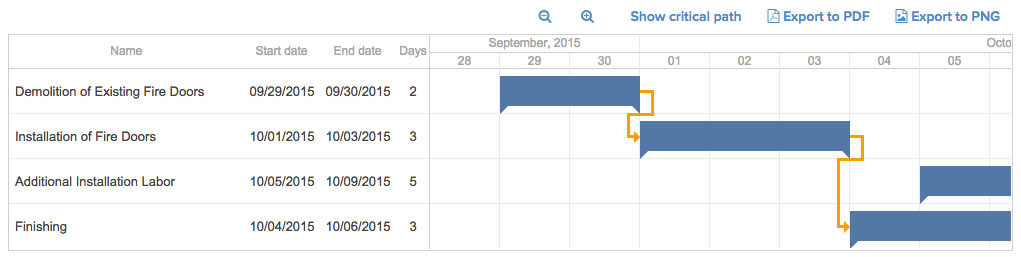
Example of a Gantt chart #
A General Contractor builds a Gantt chart for her/his upcoming remodeling project. It begins with a Preconstruction phase, which includes as sub-phases (or tasks) the invitation to bid process, permitting, and other standard preconstruction items. Each of those items has a date range ascribed to it, which together roll up into the total duration of the Preconstruction phase.
The next phase is the first phase of construction, which is Site preparation and demolition. The Gantt chart shows an arrow connecting from Preconstruction to Site preparation and demolition, since construction work cannot begin until things like subcontractor selection and permitting, contained in the Preconstruction phase, are completed. As before, the Site preparation and demolition phase is broken down into tasks, each with its own set of dates. This process continues until it covers the entirety of the construction project.
Gantt charts in Knowify #
Knowify offers a wide array of scheduling tools and resources, including Gantt charts. We are pleased to share that Knowify is able to offer views beyond what traditional scheduling software (like Primavera or MS Project) can typically provide. If you use Knowify’s powerful budgeting and expense tracking features, your Knowify Gantt charts will be able to offer you a view on cash flow timings on your projects, which can be very helpful as you try to manage your liquidity!
See how it works: