
We’ve all seen reports on how the construction industry has been doing over the last few turbulent months: the USG + U.S. Chamber of Commerce Commercial Construction Index (CCI) dropped 26% from Q1 2020 to Q2 2020, and housing starts declined by 45% between February and May 2020, according to the US Census Bureau. These numbers are not a surprise to anyone. Many regions of the United States and Canada have been seriously hit by total or partial lockdowns and, where activity was able to resume early, new regulations were put in place to contain the propagation of the virus, adding more complexity to new and existing construction projects.
Most of these reports, however, provide a general perspective on construction activity without getting into details about how individual contractors are doing. The natural question for us here at Knowify was: how are small and medium contractors faring in this environment? This is certainly a question we can answer, at least from the perspective of the most forward-looking and efficient contractors that use technology like Knowify.
With Knowify, contracting businesses keep all their project data organized in one place. They can bid for new projects, track existing projects, and invoice their customers. It’s all about being more efficient by digitally transforming the operations-side of a construction business. Given that most of the project lifecycle happens within Knowify, we have a good understanding on how many new projects are getting started, how much work is being done in existing projects, or how the value of these projects is fluctuating.
So, using Knowify data, let’s try to answer the following questions
- To what extent did activity slow down in March and April?
- Are contractors mostly working on projects from their backlog, or actually adding new projects to their pipeline?
- How fast are we recovering now?
- Are new projects shrinking in scope?
To perform our analysis, we took a sample of 500 companies that were running on Knowify continuously from January 2019 to July 2020. We anonymized and aggregated their data, and removed outliers. With this dataset, we were able to compare how the same companies have evolved over time and to what extent this pandemic has impacted their business.
Analysis I – Number of projects and life cycle
Let’s start by analyzing the number of projects that these 500 companies were working on in July 2019 and 2020:
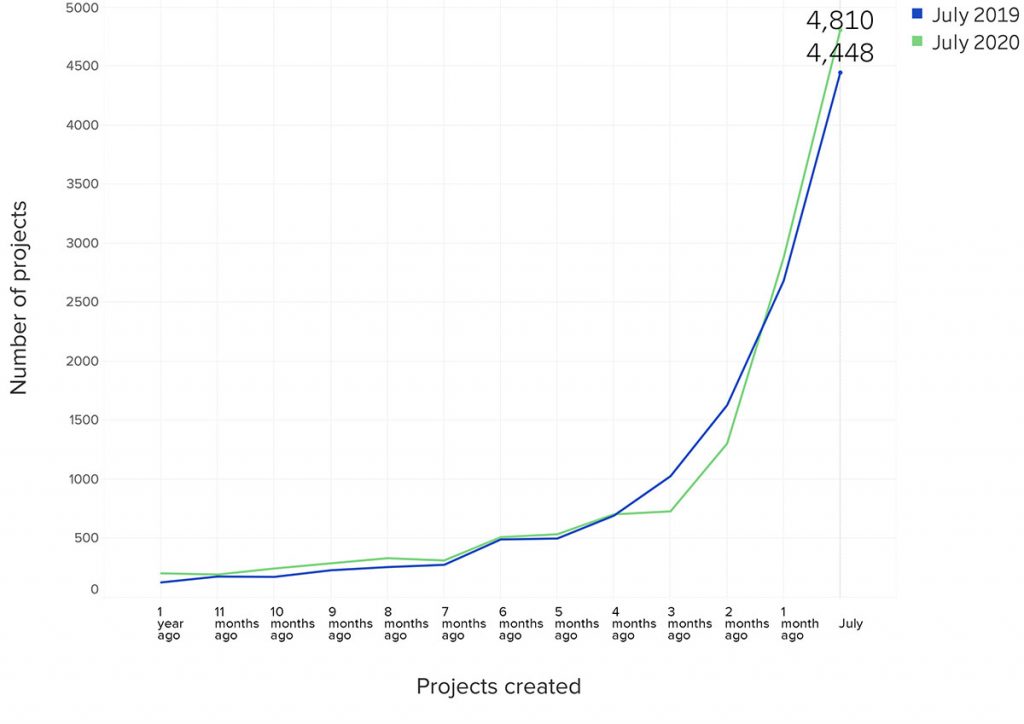
The chart above aggregates projects that had activity in the month of July. So the green line are projects with activity in July 2020, and the blue line are projects with activity in July 2019. The x axis represents the month in which those projects were created in Knowify. For instance, in July 2019, these 500 Knowify companies were working on a total of approx 3,000 projects that had started one month before (June 2019) and only on 250 projects that had started in December 2018. This is consistent with what we already knew about companies using Knowify: the average project at Knowify lasts 70 days, 40 days being the median, so most projects with activity in July will start between May and July. As you can see, the green line is consistently above the blue line for most of the period. This is great, as it shows that these 500 companies were, in aggregate, taking on a larger number of projects than a year ago—meaning that they were able to grow with Knowify. But what it’s also true is that the creation of projects dipped in March/April 2020 compared to the previous year, quickly catching up in mid May of 2020.
So what did we learn from this first analysis?
To what extent did activity slow down in March and April?
We can certainly see a drop of approximately 25% in the number of projects that originated in March and April. This is very consistent with the CCI index.
Are contractors mostly working on projects from their backlog?
The data suggests that, in July 2020, Knowify contractors are working on projects that they have recently added to their pipeline, rather than working projects they already had in their backlog. It’s true that at the beginning of the chart, which contains the oldest projects, the green line is above the blue line, but that’s consistent with the whole period and only indicates that contractors are taking on more projects in general, not just stretching the existing ones.
How fast are we recovering now?
Despite the pandemic, the pace at which projects have been created after May has exceeded the previous year. These 500 companies are working on almost 10% more projects than a year ago, and these projects have been added at a very healthy rate since May 2020.
Are we just experiencing a catch-up effect or a back-to-normal trend?
It’s too early to tell. Given that the curves in the chart show a steady normalization (rather than a spike), we tend to believe this is not the result of catching up with all the projects that these contractors would have taken during the beginning of the pandemic. That being said, we’ll need a few more months of data to answer this question.
So this is good news! If most contractors were just working on projects in the backlog and not adding new projects, we could see the project pipeline drying out by the end of 2020 and contractors running out of work; but that just doesn’t seem to be the case based on our data.
Analysis II – Volume vs. Value
As we all know, the number of projects is not the only thing that matters. What about the value of these projects? Have new projects decreased in scope? Have bids been lowered to make up for the decrease in spending?
Let’s have a look at the total contract value and date of creation of projects that had activity in the month of July:
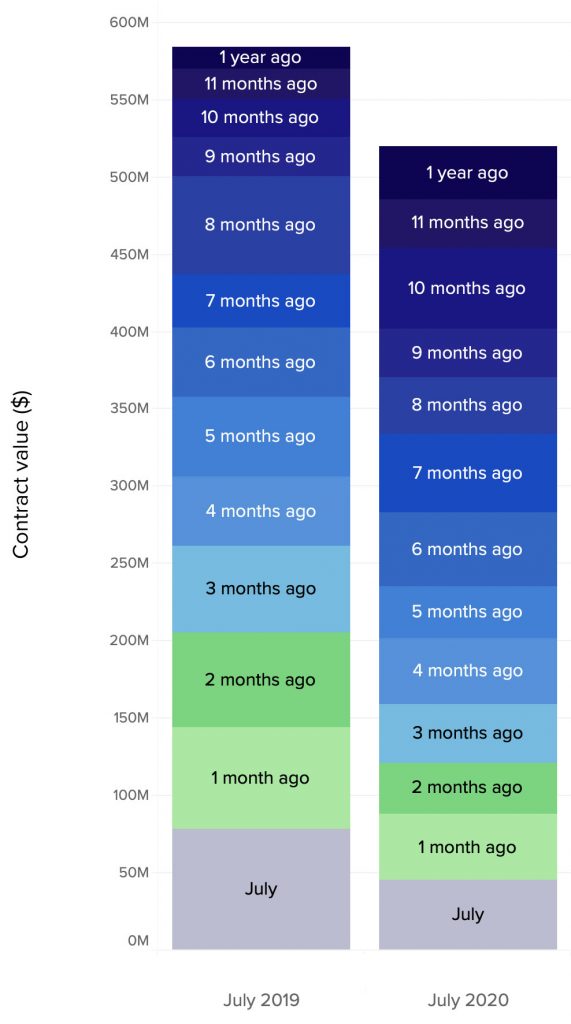
The data clearly shows that new projects are smaller. While Knowify contractors are working on more projects, the total value of these projects is 15% lower than a year ago. There could be several explanations for this, but what seems more likely is that new projects are being broken down in smaller scopes of work, or contractors are being more aggressive with their bids to keep their pipeline full.
So what did we learn from this second analysis?
Are new projects shrinking in scope?
Yes. This is consistent with the behavior we’ve seen during previous recessions: as the market gets tighter and the competition for new projects stronger, contract values go down and the ability of a contracting business to generate leads and stay effective with their bidding is paramount.
Running a contracting business is very complex. Not only because the construction process is complicated, but also because managing a business based on resource utilization is highly dependent on having a predictable pipeline of projects. During a downturn, unfortunately, the pipeline is everything but predictable, which means you have to focus on the things you can actually control. These things will usually involve being very effective with bidding and very disciplined around job costing.
If you have questions on this analysis or would like to share your thoughts with us, you can contact me via LinkedIn or you can send an email to the Knowify team.
This study has been performed by Marc Visent, CEO and co-founder of Knowify, and Núria Macià, PhD, data scientist at Knowify, with the collaboration of Dan de Roulet, co-founder of Knowify.